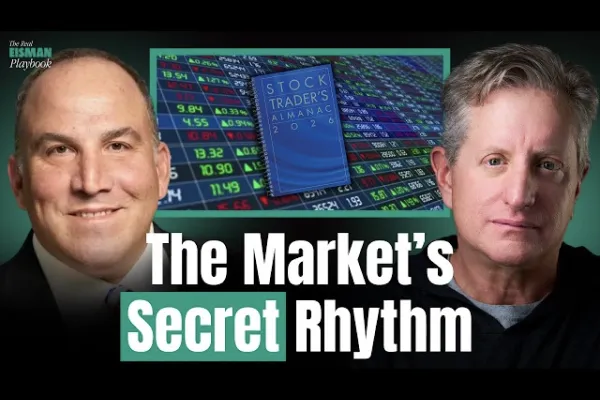
Market Patterns Explained: What the Stock Trader’s Almanac Gets Right
Introduction
Markets often feel chaotic.
Wars break out. Interest rates shift. New technologies disrupt entire industries.
And yet—despite all of that—patterns keep showing up.
That’s the core idea behind the Stock Trader’s Almanac, a decades-old framework built on one simple premise:
Markets move not just on data—but on human behavior.
In a recent discussion, this idea was explored through historical patterns, seasonal trends, and the psychology behind how money actually flows through markets.
Let’s break down what truly matters.
The Core Premise: Markets Are Driven by Human Behavior
At the heart of market seasonality is something simple:
People are predictable
Institutions follow cycles
Money moves in patterns
Even in a world dominated by algorithms:
Algorithms are still designed by humans.
So the behavior doesn’t disappear—it just gets encoded.
This is why patterns like:
Monthly flows
Quarterly repositioning
Election cycles
…continue to repeat over decades.
The “Best Six Months” Strategy
One of the most well-known patterns:
Buy in October → Sell in April
This is often misunderstood as:
“Sell in May and go away.”
But the more accurate interpretation is:
Strong period: November → April
Weaker period: May → October
Why this happens:
Institutional behavior
Funds rebalance before year-end
Poor-performing stocks get dumped (window dressing)
Capital rotates into stronger assets
Year-end momentum
Bonuses, inflows, optimism
Holiday-driven spending and investing
Retail participation
Increased activity in Q4 and early Q1
The result:
A structural flow of money into markets during this window.
The Midterm Election Pattern
Another powerful cycle comes from politics.
Historically:
Markets are volatile during midterm election years
Weakness often appears in Q2–Q3
Bottoms tend to form around September–October
After that:
Markets typically rally into the next year.
Why?
Policy uncertainty peaks before elections
Once resolved, confidence returns
Capital flows back in
This creates what some call:
“The bottom picker’s window” in midterm years.
January Effect & Market Signals
January is more than just the start of the year—it’s a signal.
Key indicators:
January Barometer
→ If January is positive, the year is often positiveFirst 5 Days Rule
→ Early momentum often continuesSanta Claus Rally
→ Last 5 days of December + first 2 days of January
When these align:
The probability of a strong year increases significantly.
Why this works:
Portfolio allocations reset
Institutional strategies activate
Market expectations get priced in
Monthly and Intraday Patterns
Patterns don’t just exist yearly—they exist daily.
Monthly flows:
End-of-month buying (fund inflows)
Mid-month spikes (salary/401k contributions)
Intraday behavior:
Weak openings
Midday slowdown
Strong closes (institutional activity)
Even with high-frequency trading:
These patterns still persist—because human decision-making still drives them.
Sector Seasonality
Different sectors move at different times.
Examples:
Energy & commodities
Often rise from winter into spring
Utilities
Perform differently across “strong vs weak” market months
These cycles are tied to:
Economic activity
Weather patterns
Industrial demand
But they’re not static.
Structural shifts (like AI or energy demand) can override historical patterns.
When Patterns Stop Working
Not all patterns last forever.
Some fade due to:
Structural changes
Market evolution
New technologies
Example:
Certain Bitcoin seasonality patterns have weakened
Older indicators no longer hold predictive value
This is critical:
Patterns are tools—not guarantees.
Markets evolve.
The Bigger Idea: Behavioral Finance in Action
All of this points to one underlying truth:
Markets are systems of behavior—not just numbers.
What drives patterns?
Fear
Incentives
Career risk (fund managers hiding losses)
Habitual decision-making
For example:
Funds sell losing stocks before reporting periods
Investors chase momentum
Institutions follow predictable cycles
These behaviors create:
Repeating, measurable patterns over time.
Final Takeaway
Markets will always have noise:
Geopolitics
Technology shifts
Economic shocks
But underneath that noise:
Human behavior remains consistent.
And that consistency creates structure.
The goal isn’t to blindly follow patterns.
It’s to understand:
When they apply
Why they exist
When they’re breaking
Because the real edge isn’t the pattern itself—
It’s understanding the behavior behind it.
Until next time, this is Steve Eisman, and this has been The Real Eyes Playbook. .
If you’d like to catch my interviews and market breakdowns, visit The Real Eisman Playbook or subscribe to the Weekly Wrap channel on YouTube.
This post is for informational purposes only and does not constitute investment advice. Please consult a licensed financial adviser before making investment decisions.


